Data (c) OpenStreetMap contributors, ODbL 1.0. https://www.openstreetmap.org/copyright
── Attaching core tidyverse packages ──────────────────────── tidyverse 2.0.0 ──
✔ dplyr     1.2.1     ✔ readr     2.2.0
✔ forcats   1.0.1     ✔ stringr   1.6.0
✔ ggplot2   4.0.3     ✔ tibble    3.3.1
✔ lubridate 1.9.5     ✔ tidyr     1.3.2
✔ purrr     1.2.2
── Conflicts ────────────────────────────────────────── tidyverse_conflicts() ──
✖ dplyr::filter() masks stats::filter()
✖ dplyr::lag()    masks stats::lag()
ℹ Use the conflicted package (<http://conflicted.r-lib.org/>) to force all conflicts to become errors
Linking to GEOS 3.14.1, GDAL 3.8.5, PROJ 9.5.1; sf_use_s2() is TRUE

There appears to be a problem with the PROJ installation
What graphs will we see today?
Variable #1
Variable #2
Chart Names
Chart Shape
Quant
Qual
Choropleth and Symbols Maps, Cartograms
Inspiration
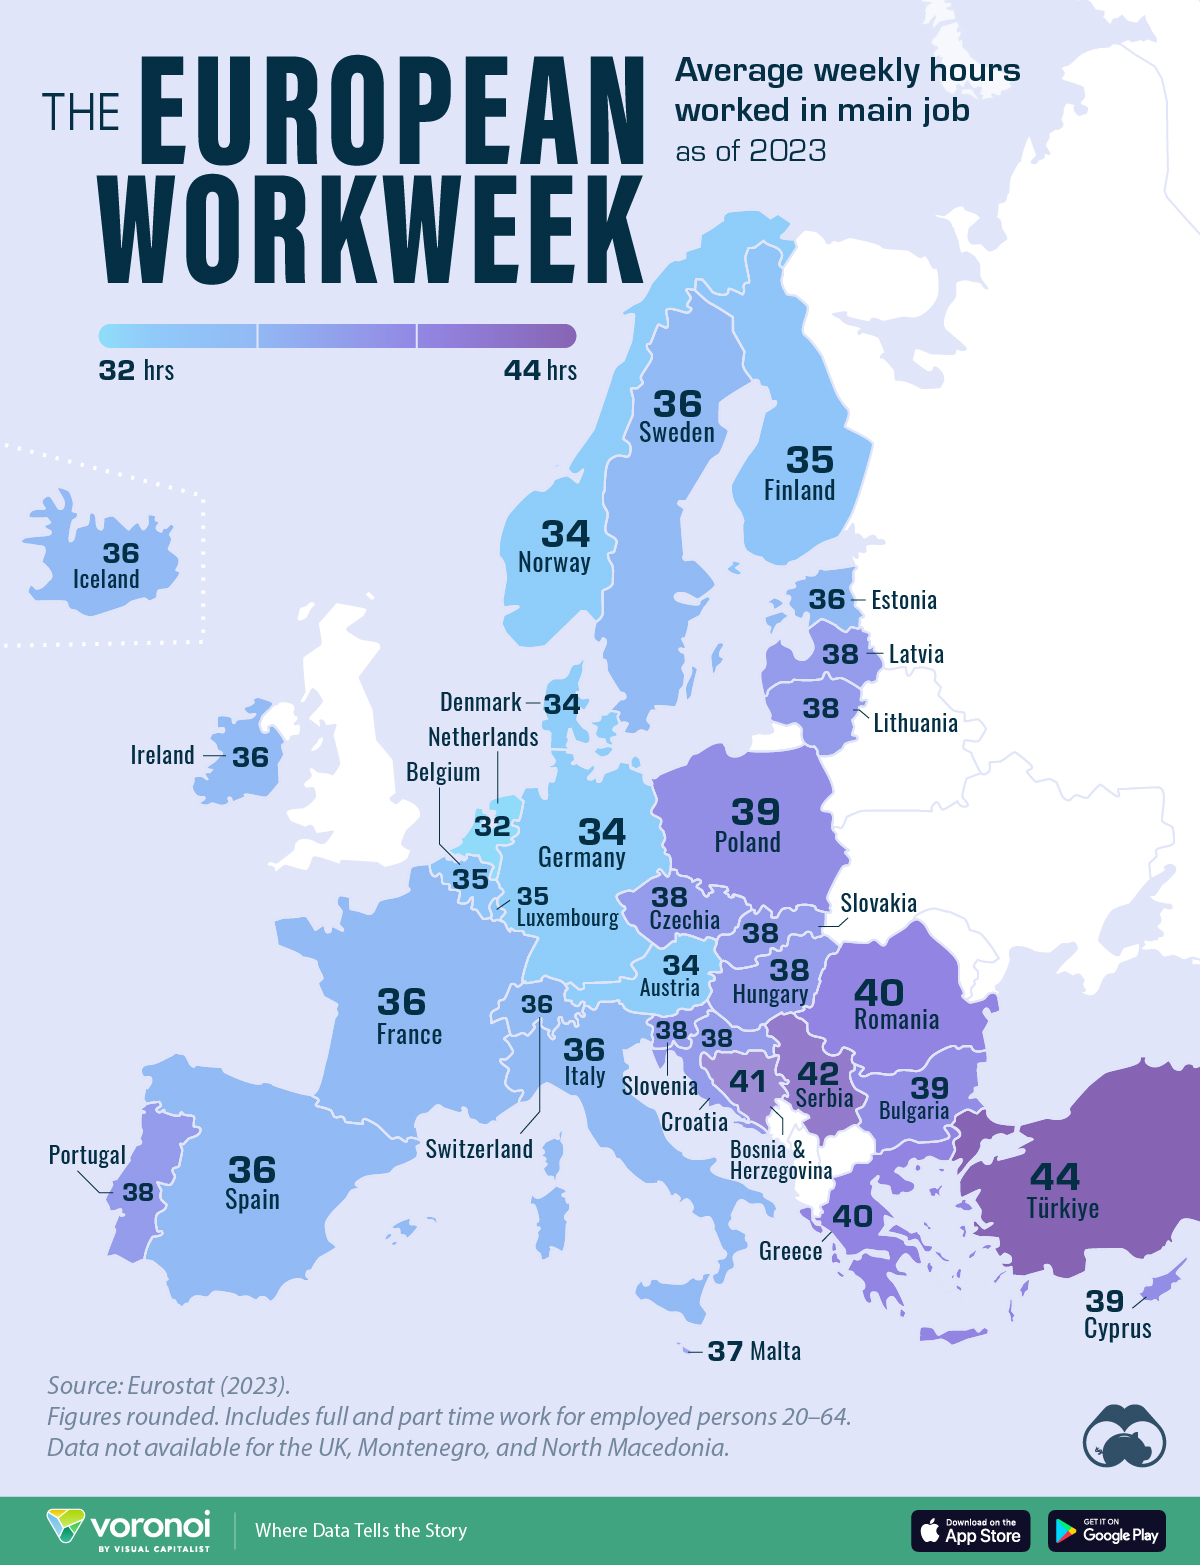
(a) Infosys in the EU
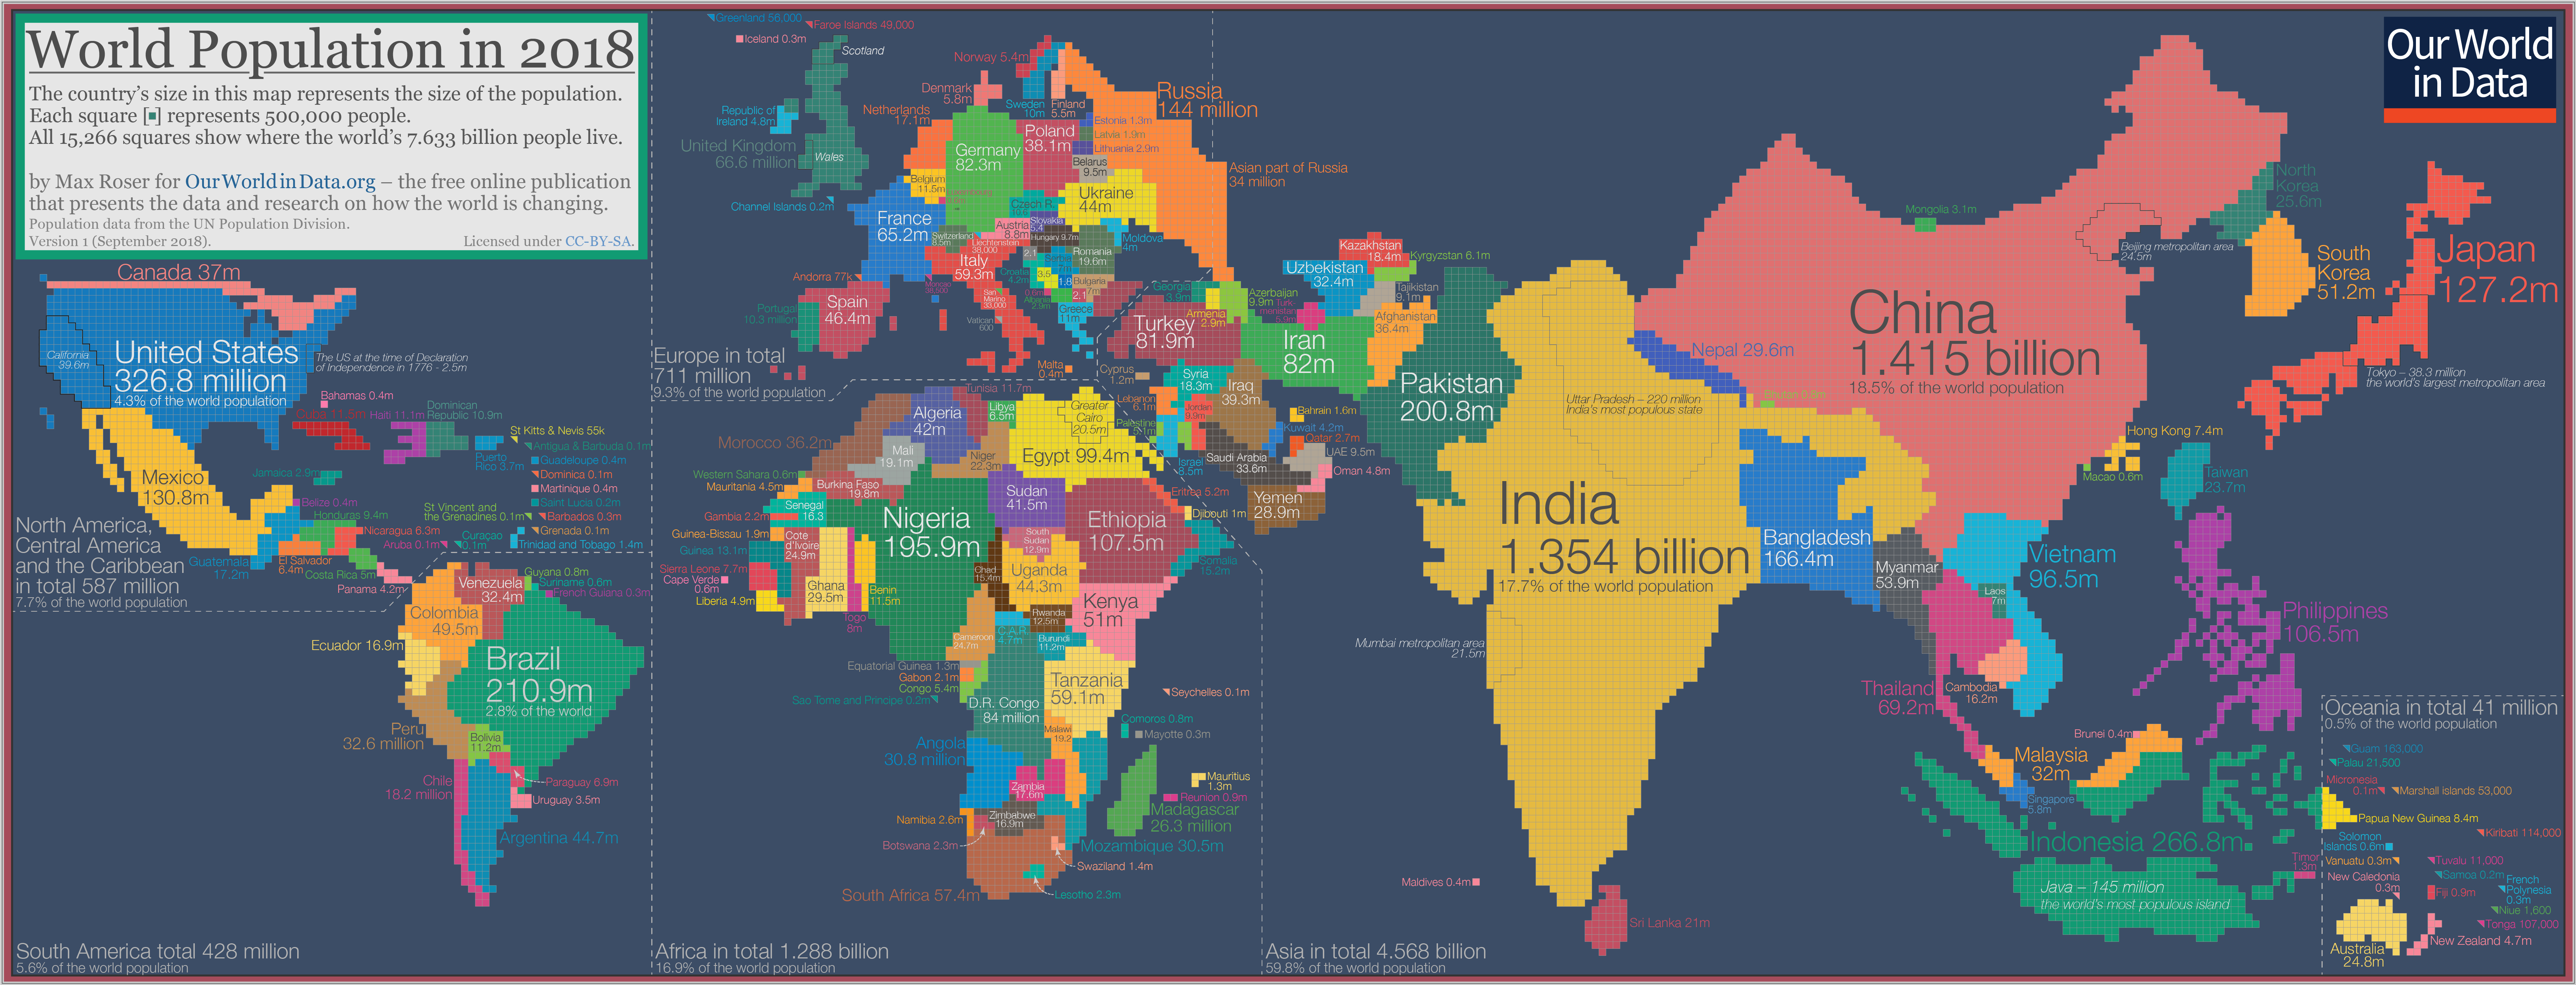
(b) Population Cartogram
Figure 1: Choropleth and Cartogram
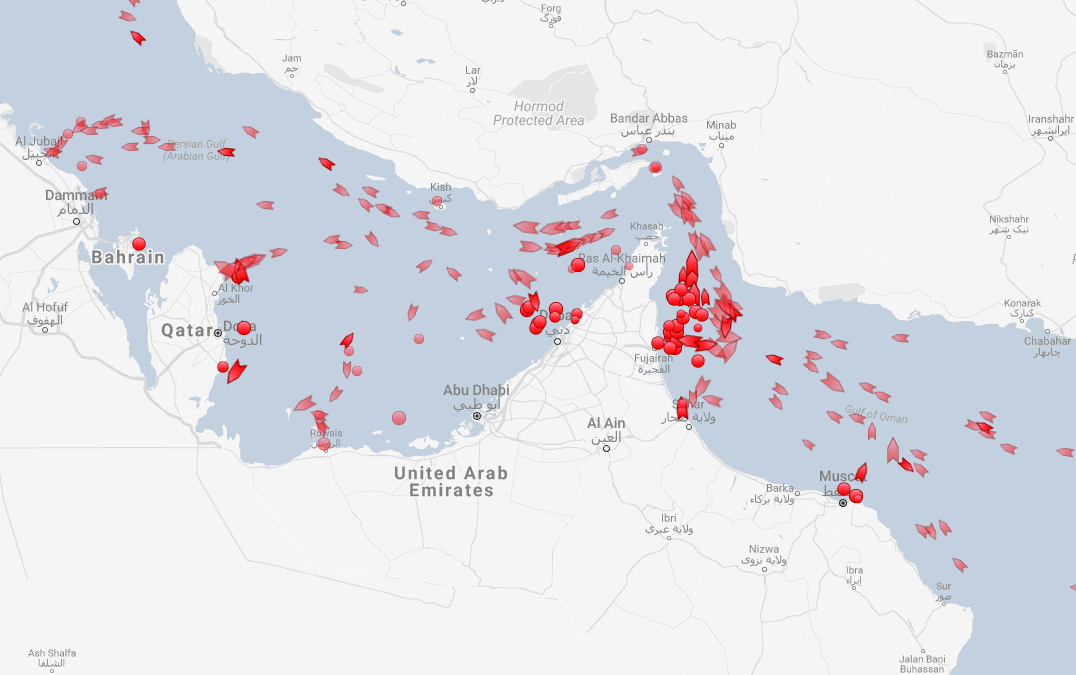
(a) Where’s the next Houthi attack?
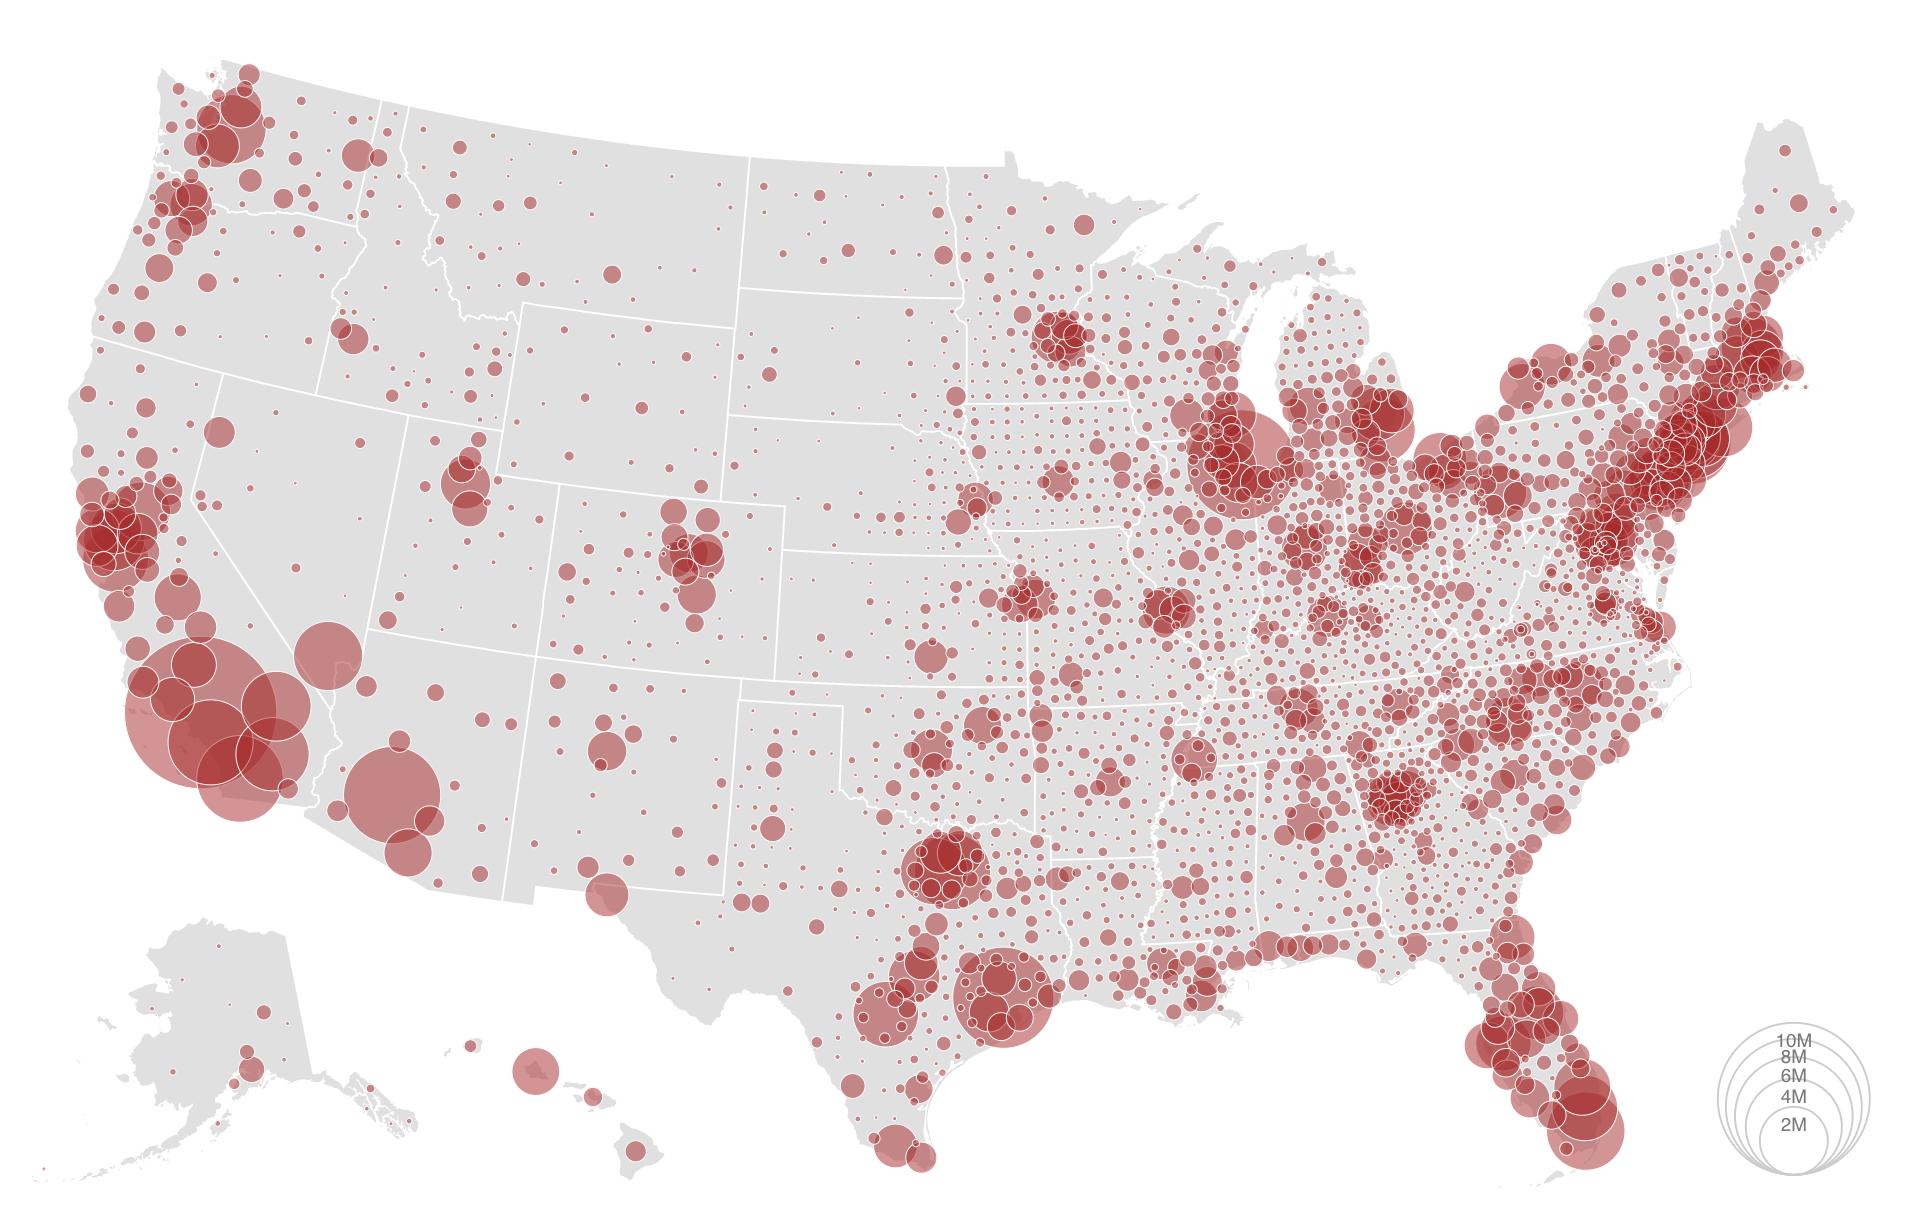
(b) Malacca
Figure 2: Symbol Maps
How do these Chart(s) Work?
In Figure 1 (a), we have a choropleth map. What does choropleth1 mean? And what kind of information could this map represent? The idea is to colour a specific area of the map, a district or state, based on a Quant or a Qual variable.
The Figure 1 (b) deliberately distorts and scales portions of the map in proportion to a Quant variable, in this case, population in 2018.
In Figure 2 (a) and Figure 2 (b), symbols are used to indicate either the location/presence of an item of interest, or a quantity by scaling their size in proportion to a Quant variable
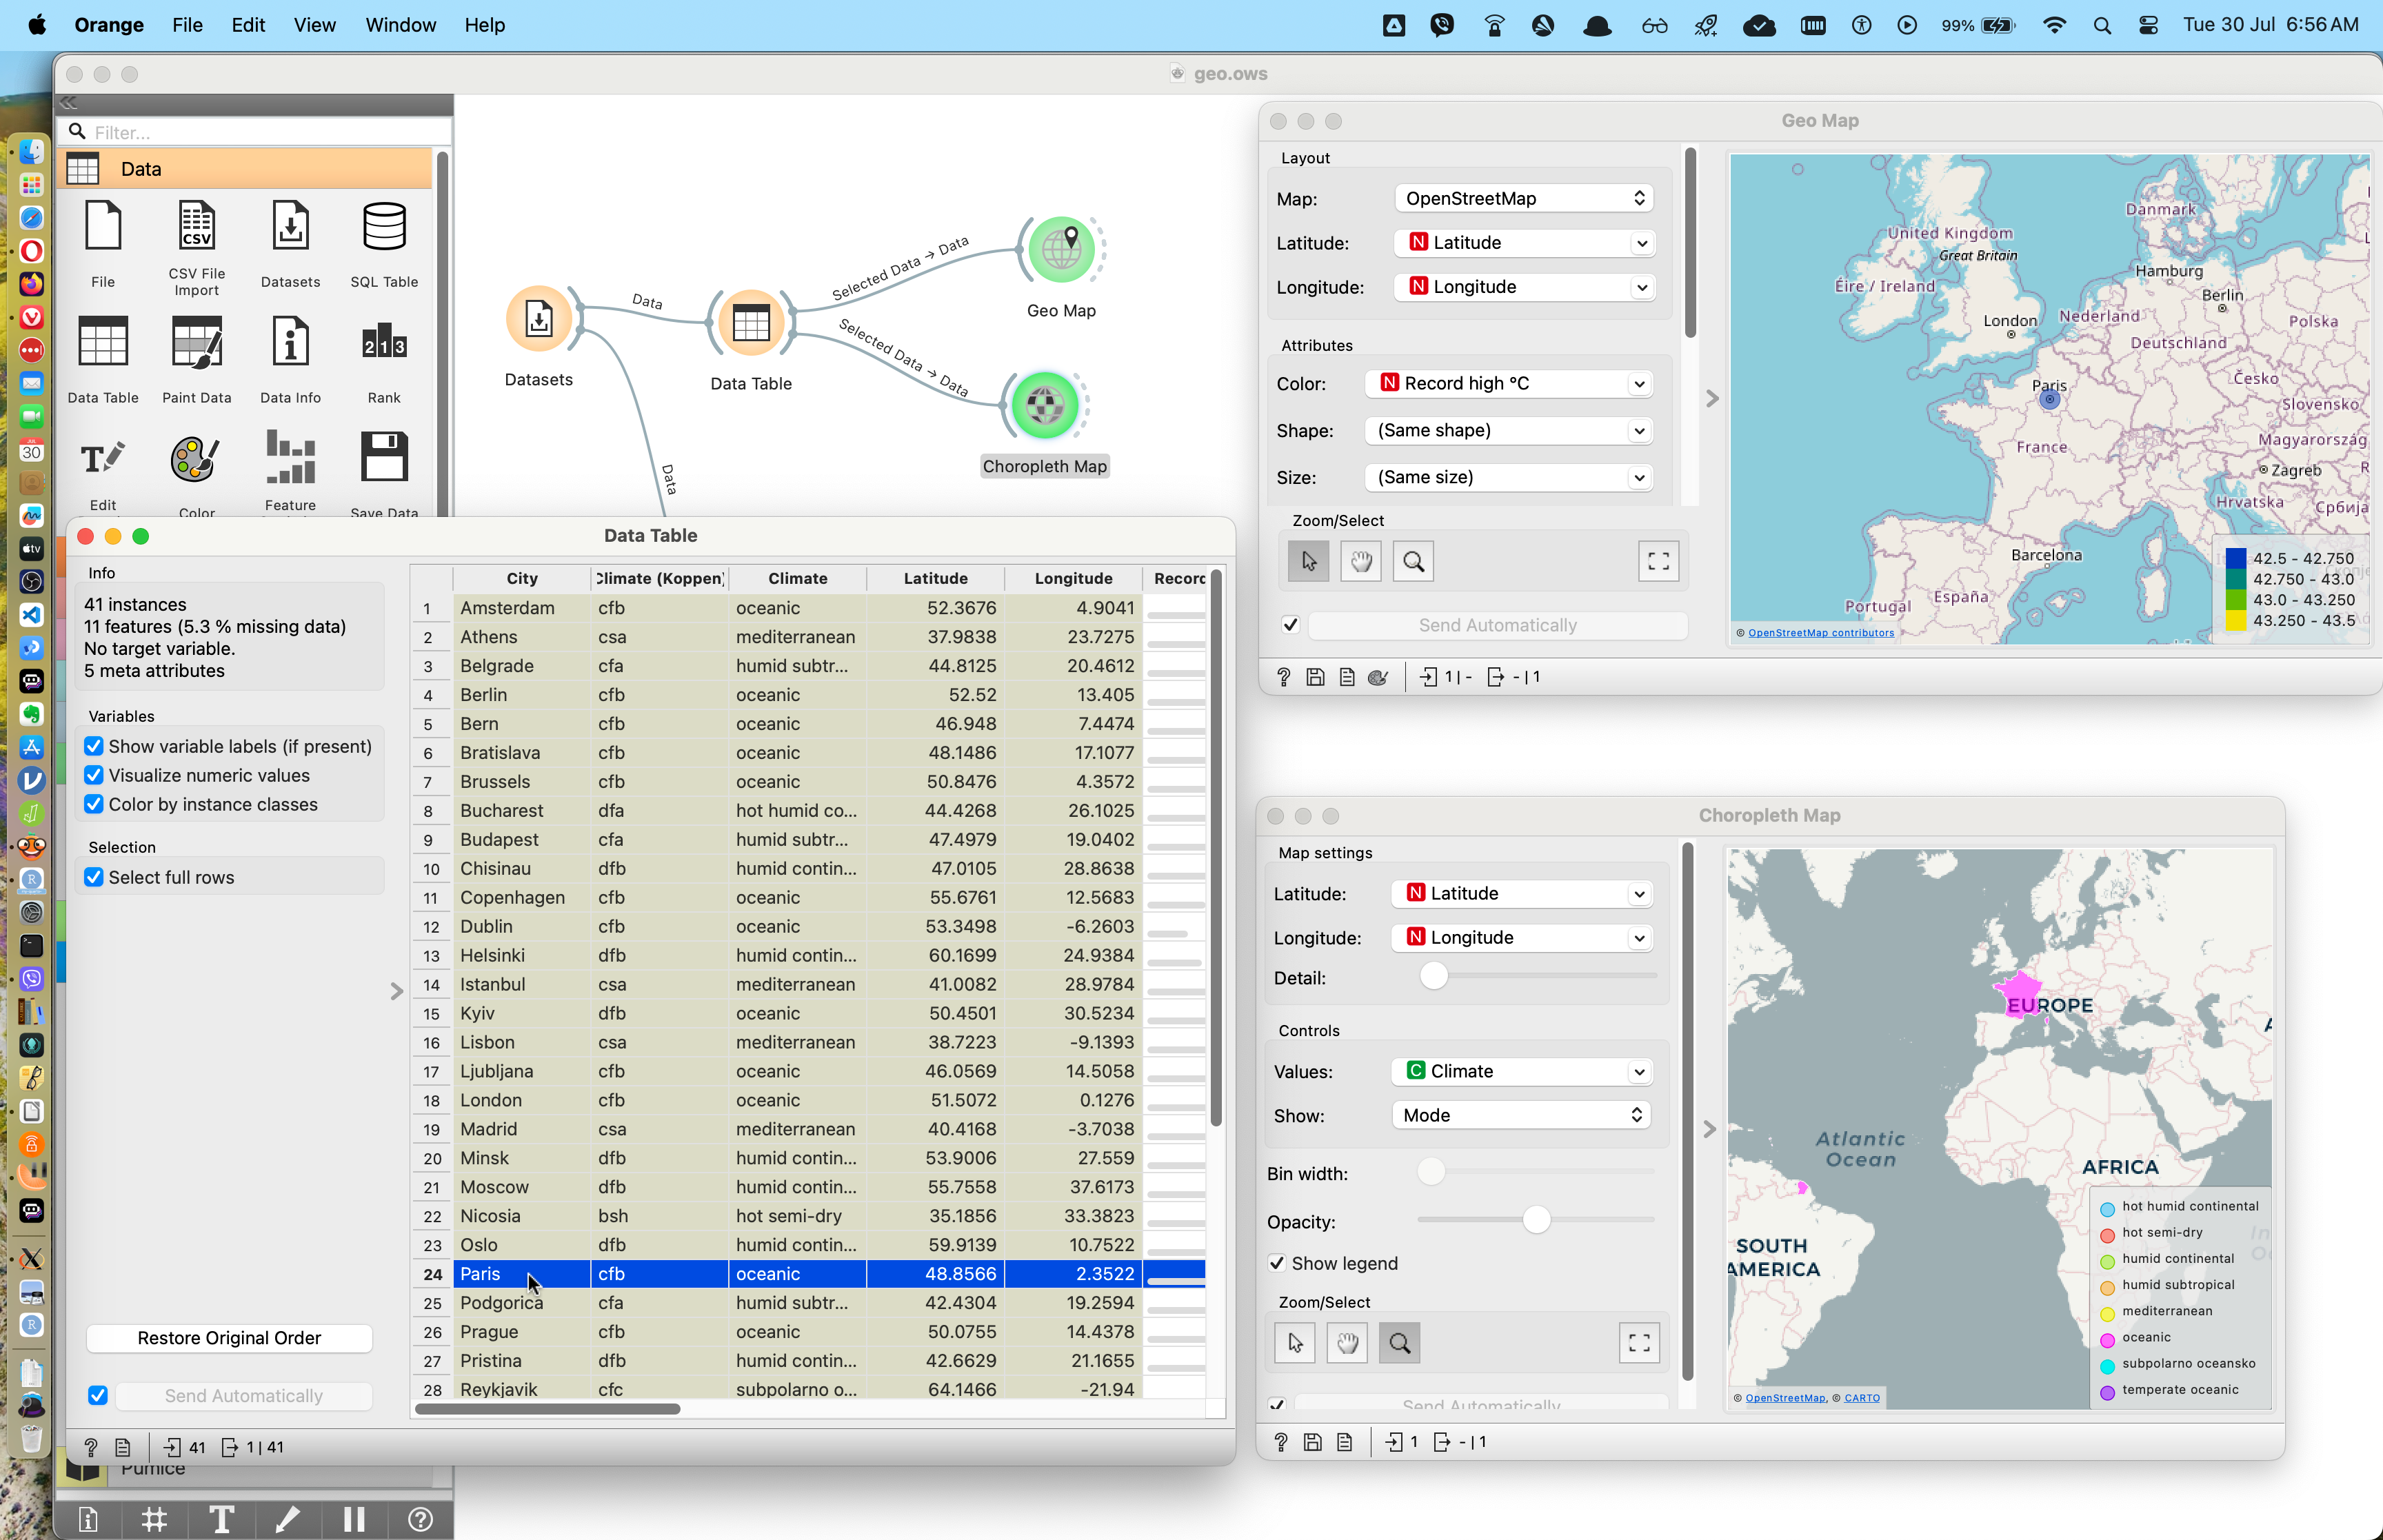
Let us use a built-in dataset in Orange to create a Symbol/bubble/Choropleth map. This dataset pertains to the climate in several European cities. Here is the workflow:
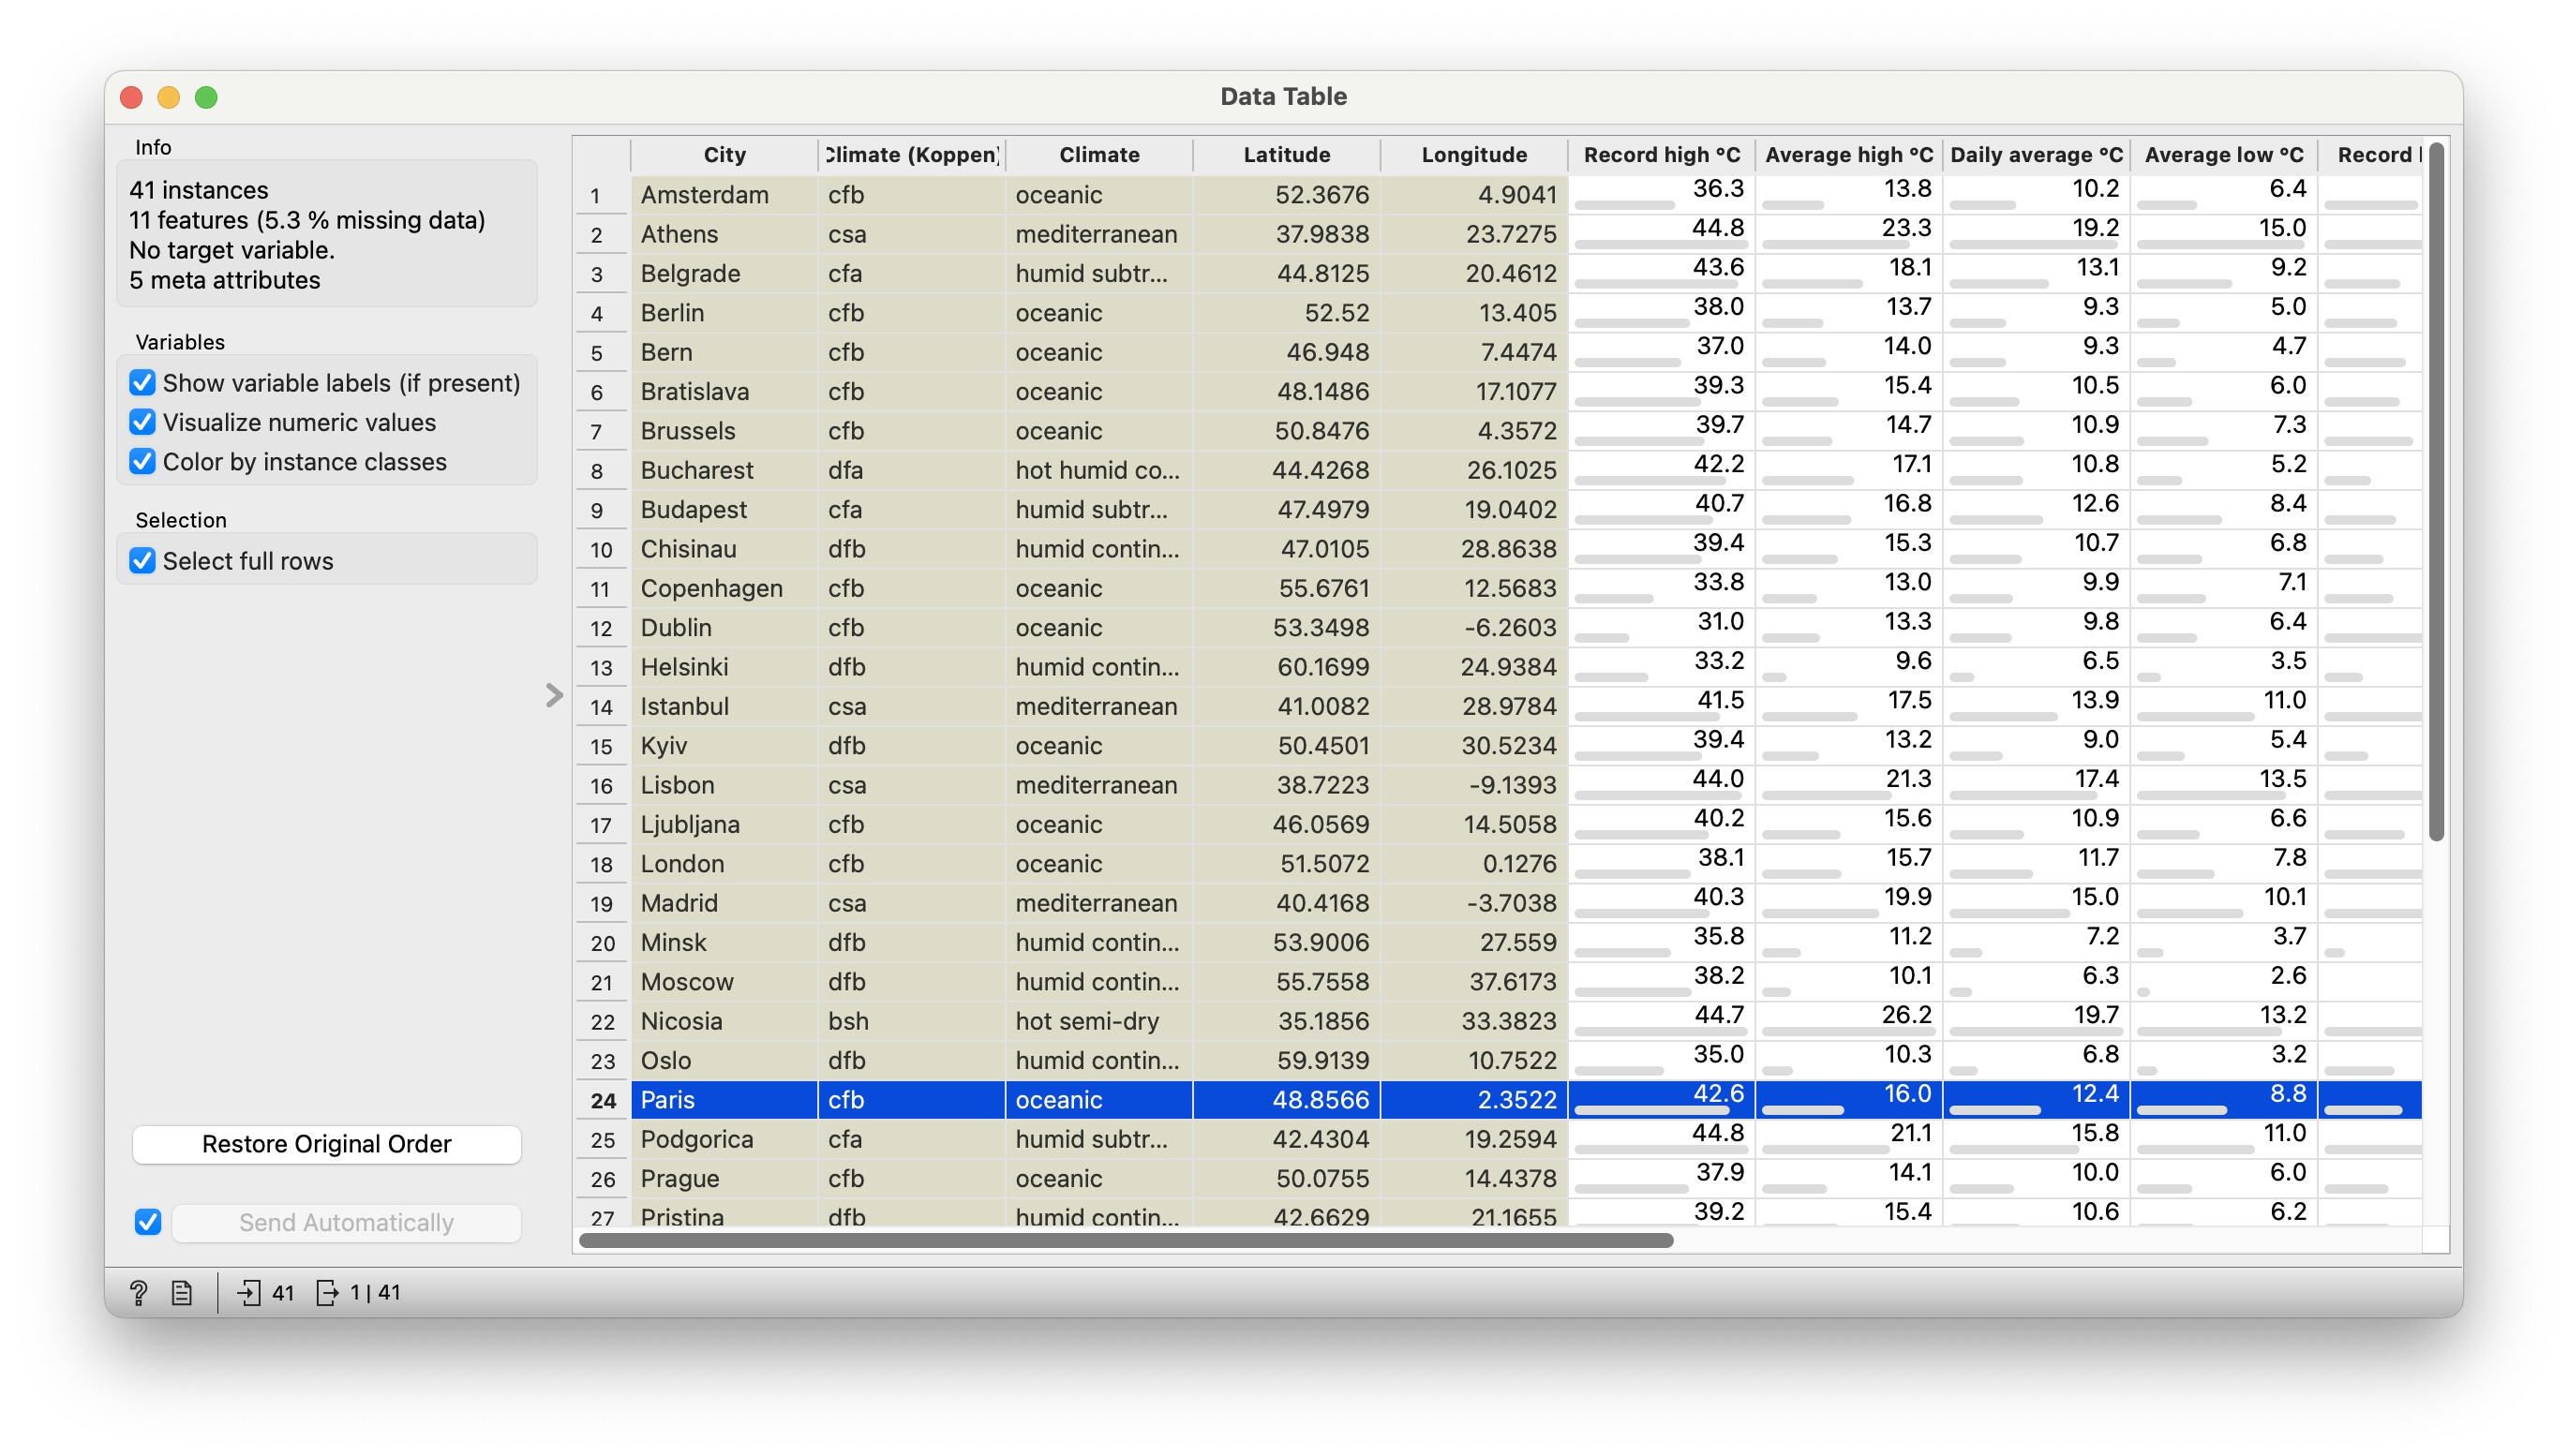
Let us look first at the data table.
Figure 3: European Cities Data Table
Data Dictionary
NoteQualitative Data
City: City in Europe
Climate: One of six types: oceanic, meditterranean, humid…etc.
Climate(koppen): Some sort of climate classification(acronym?)
Quantitative Data
All other variables are Quantitative. These pertain to temperature,rainfall, humidity, sunshine, and ultraviolet radiation.
Longitude and Latitude are also Quant
ImportantLong and Lat
Note the presence of specific Longitude Latitude columns in the data. Why am I saying this in that peculiar order ??💭
Figure 4: European Cities Maps
We have directed the output of the Data Table widget to the Geo Map widget, so that the selected citie(s) show up as symbols on the map. The symbol colour is proportional to one of the other “non-locational” Quant variables. It can also be a Qual variable.
We can also connect the same output to the Choropleth Map widget. However in this case, Orange colours the country in which the chosen city is located, based on the selected Quant/Qual variable for colour.
NoteBase Map
Note how Orange “gets hold” of a base map of Europe to plot the cities on. These are built-in datasets / automatically downloaded by Orange using free map services such as Open Street Map
Suppose we have our own data, of places we have visited. Let us cook up such a dataset manually (in Excel) without Long and Lat, and we can then Geo Code the places plot them based on some other parameter of interest.
Geocoding widget extracts latitude/longitude pairs from region names or synthesizes latitude/longitude to return region name. If the region is large, say a country, encoder with return the latitude and longitude of geometric centre.
Here is a Excel to download; you should plot this first and then edit the places and its characteristics to suit your own research.
Note that this dataset does have longitude and latitude data. We will import this into Orange and deliberatelyGeo Code this, just to compare.
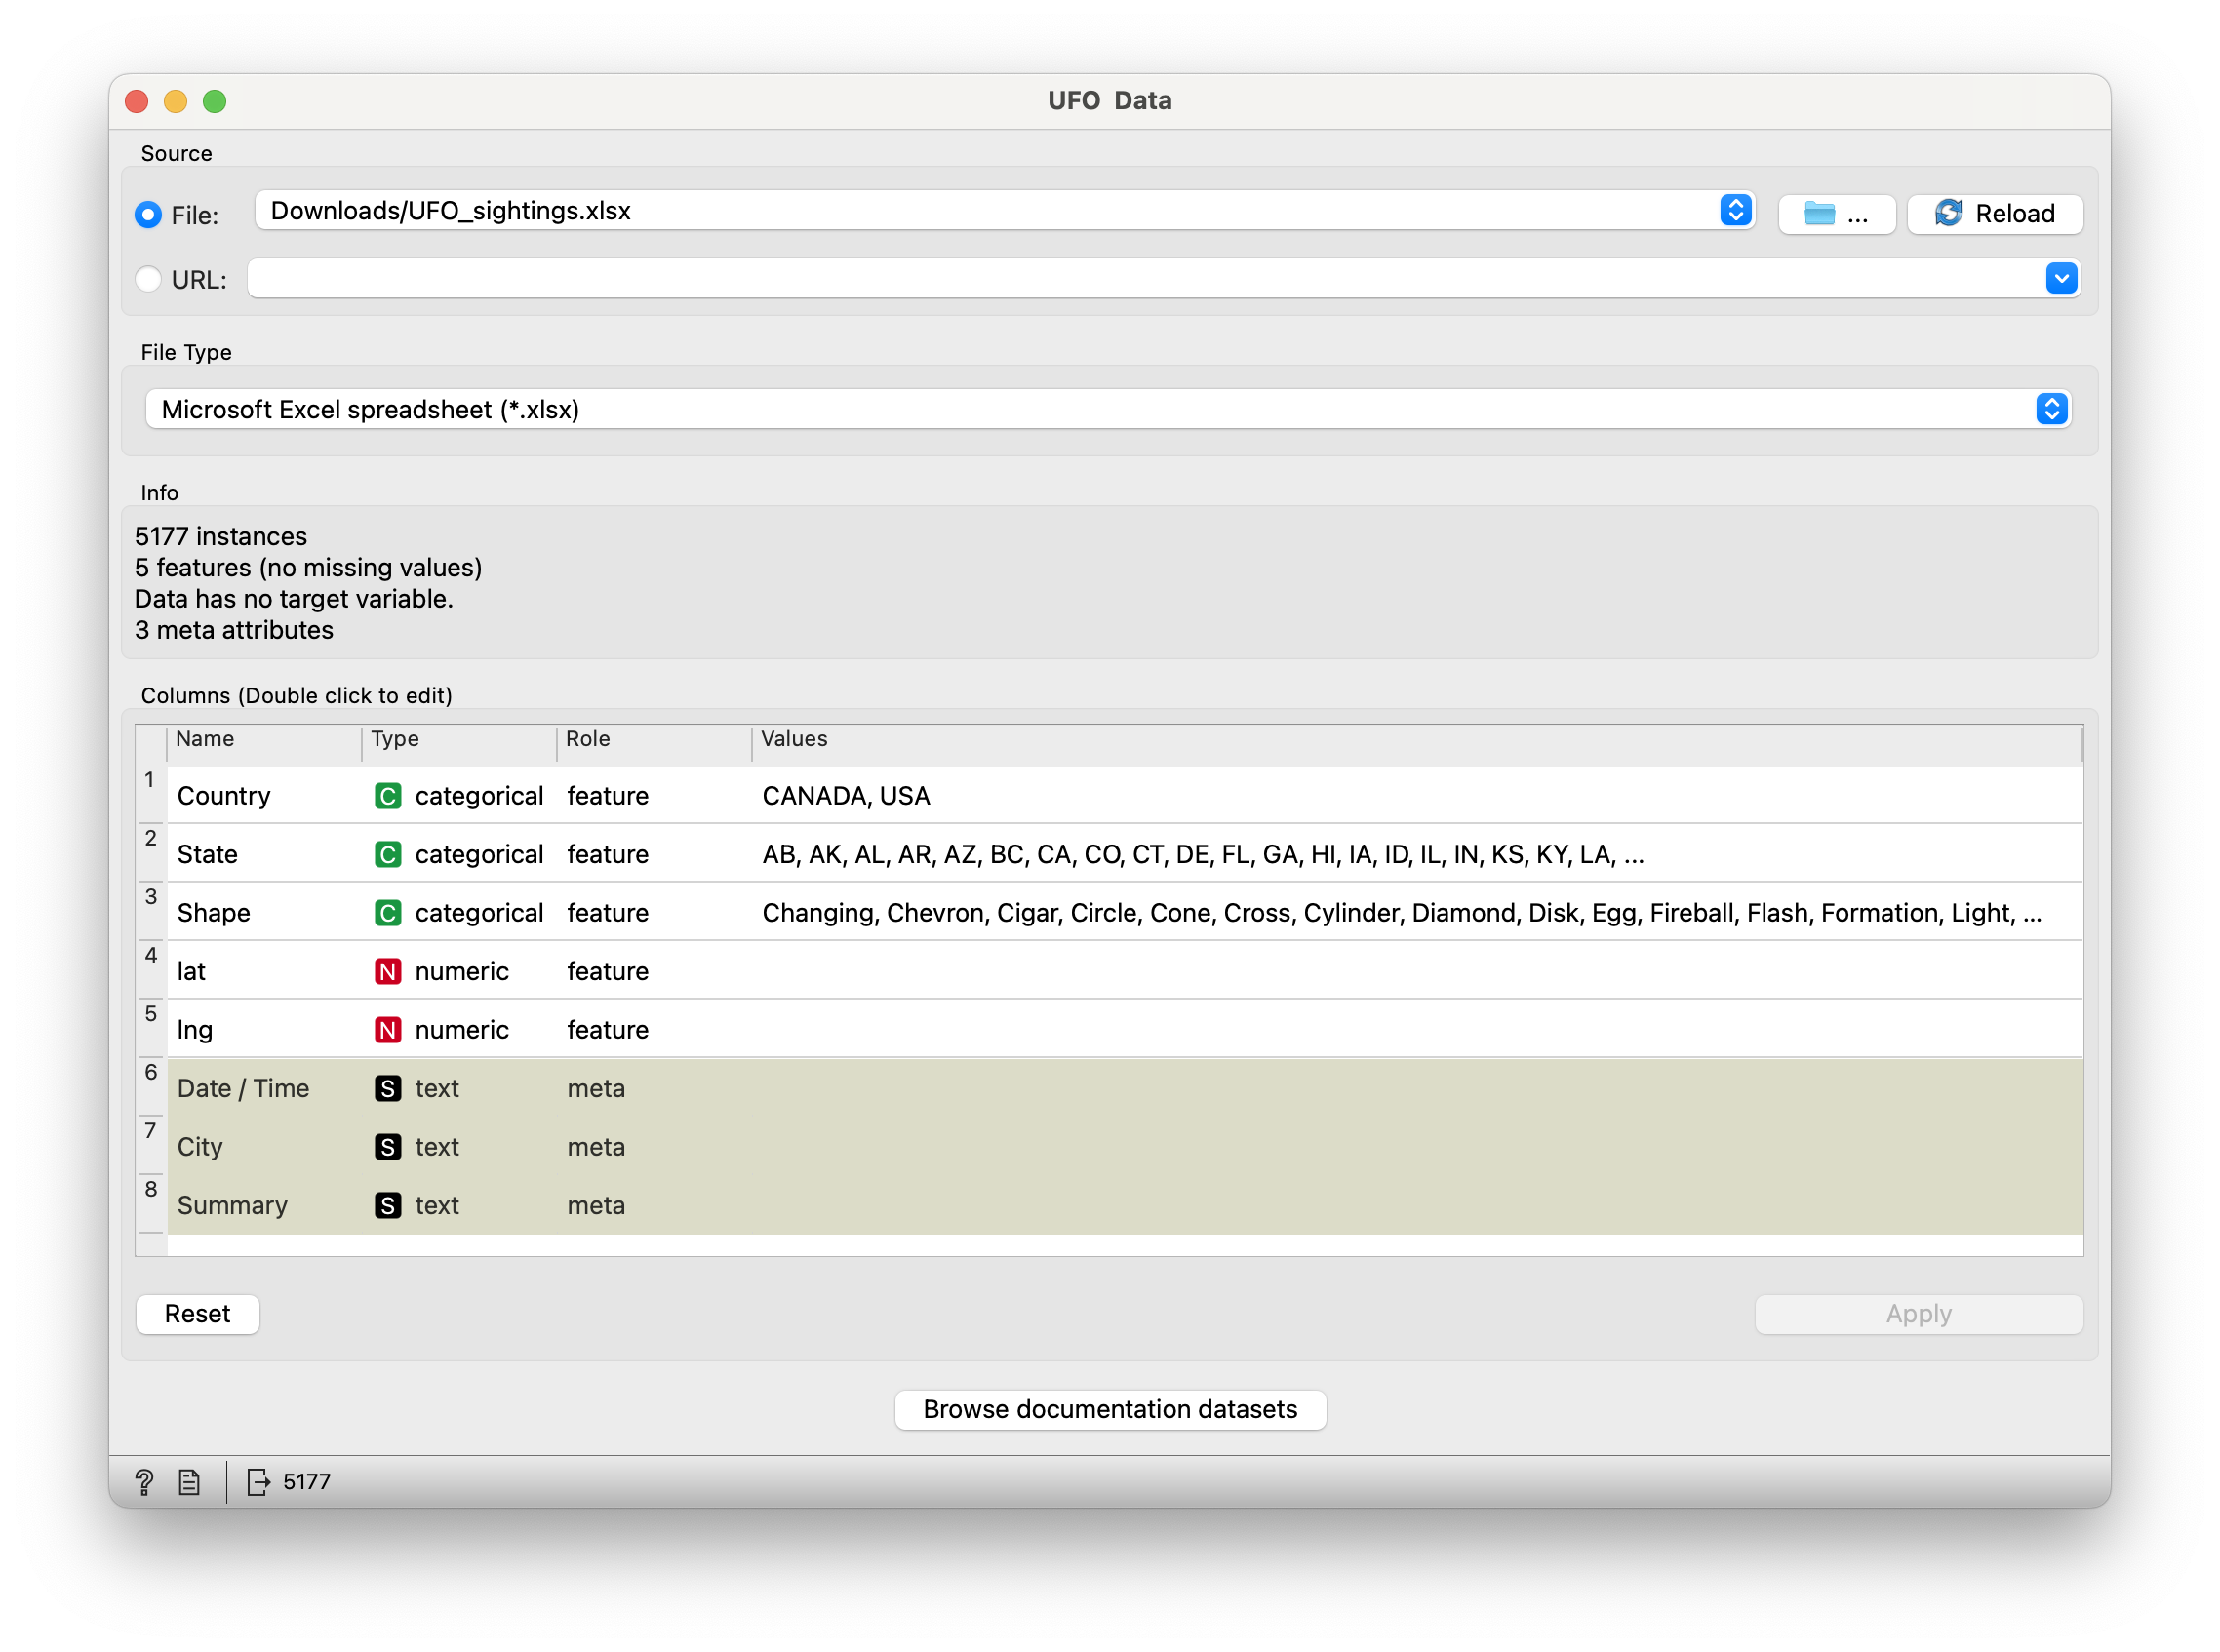
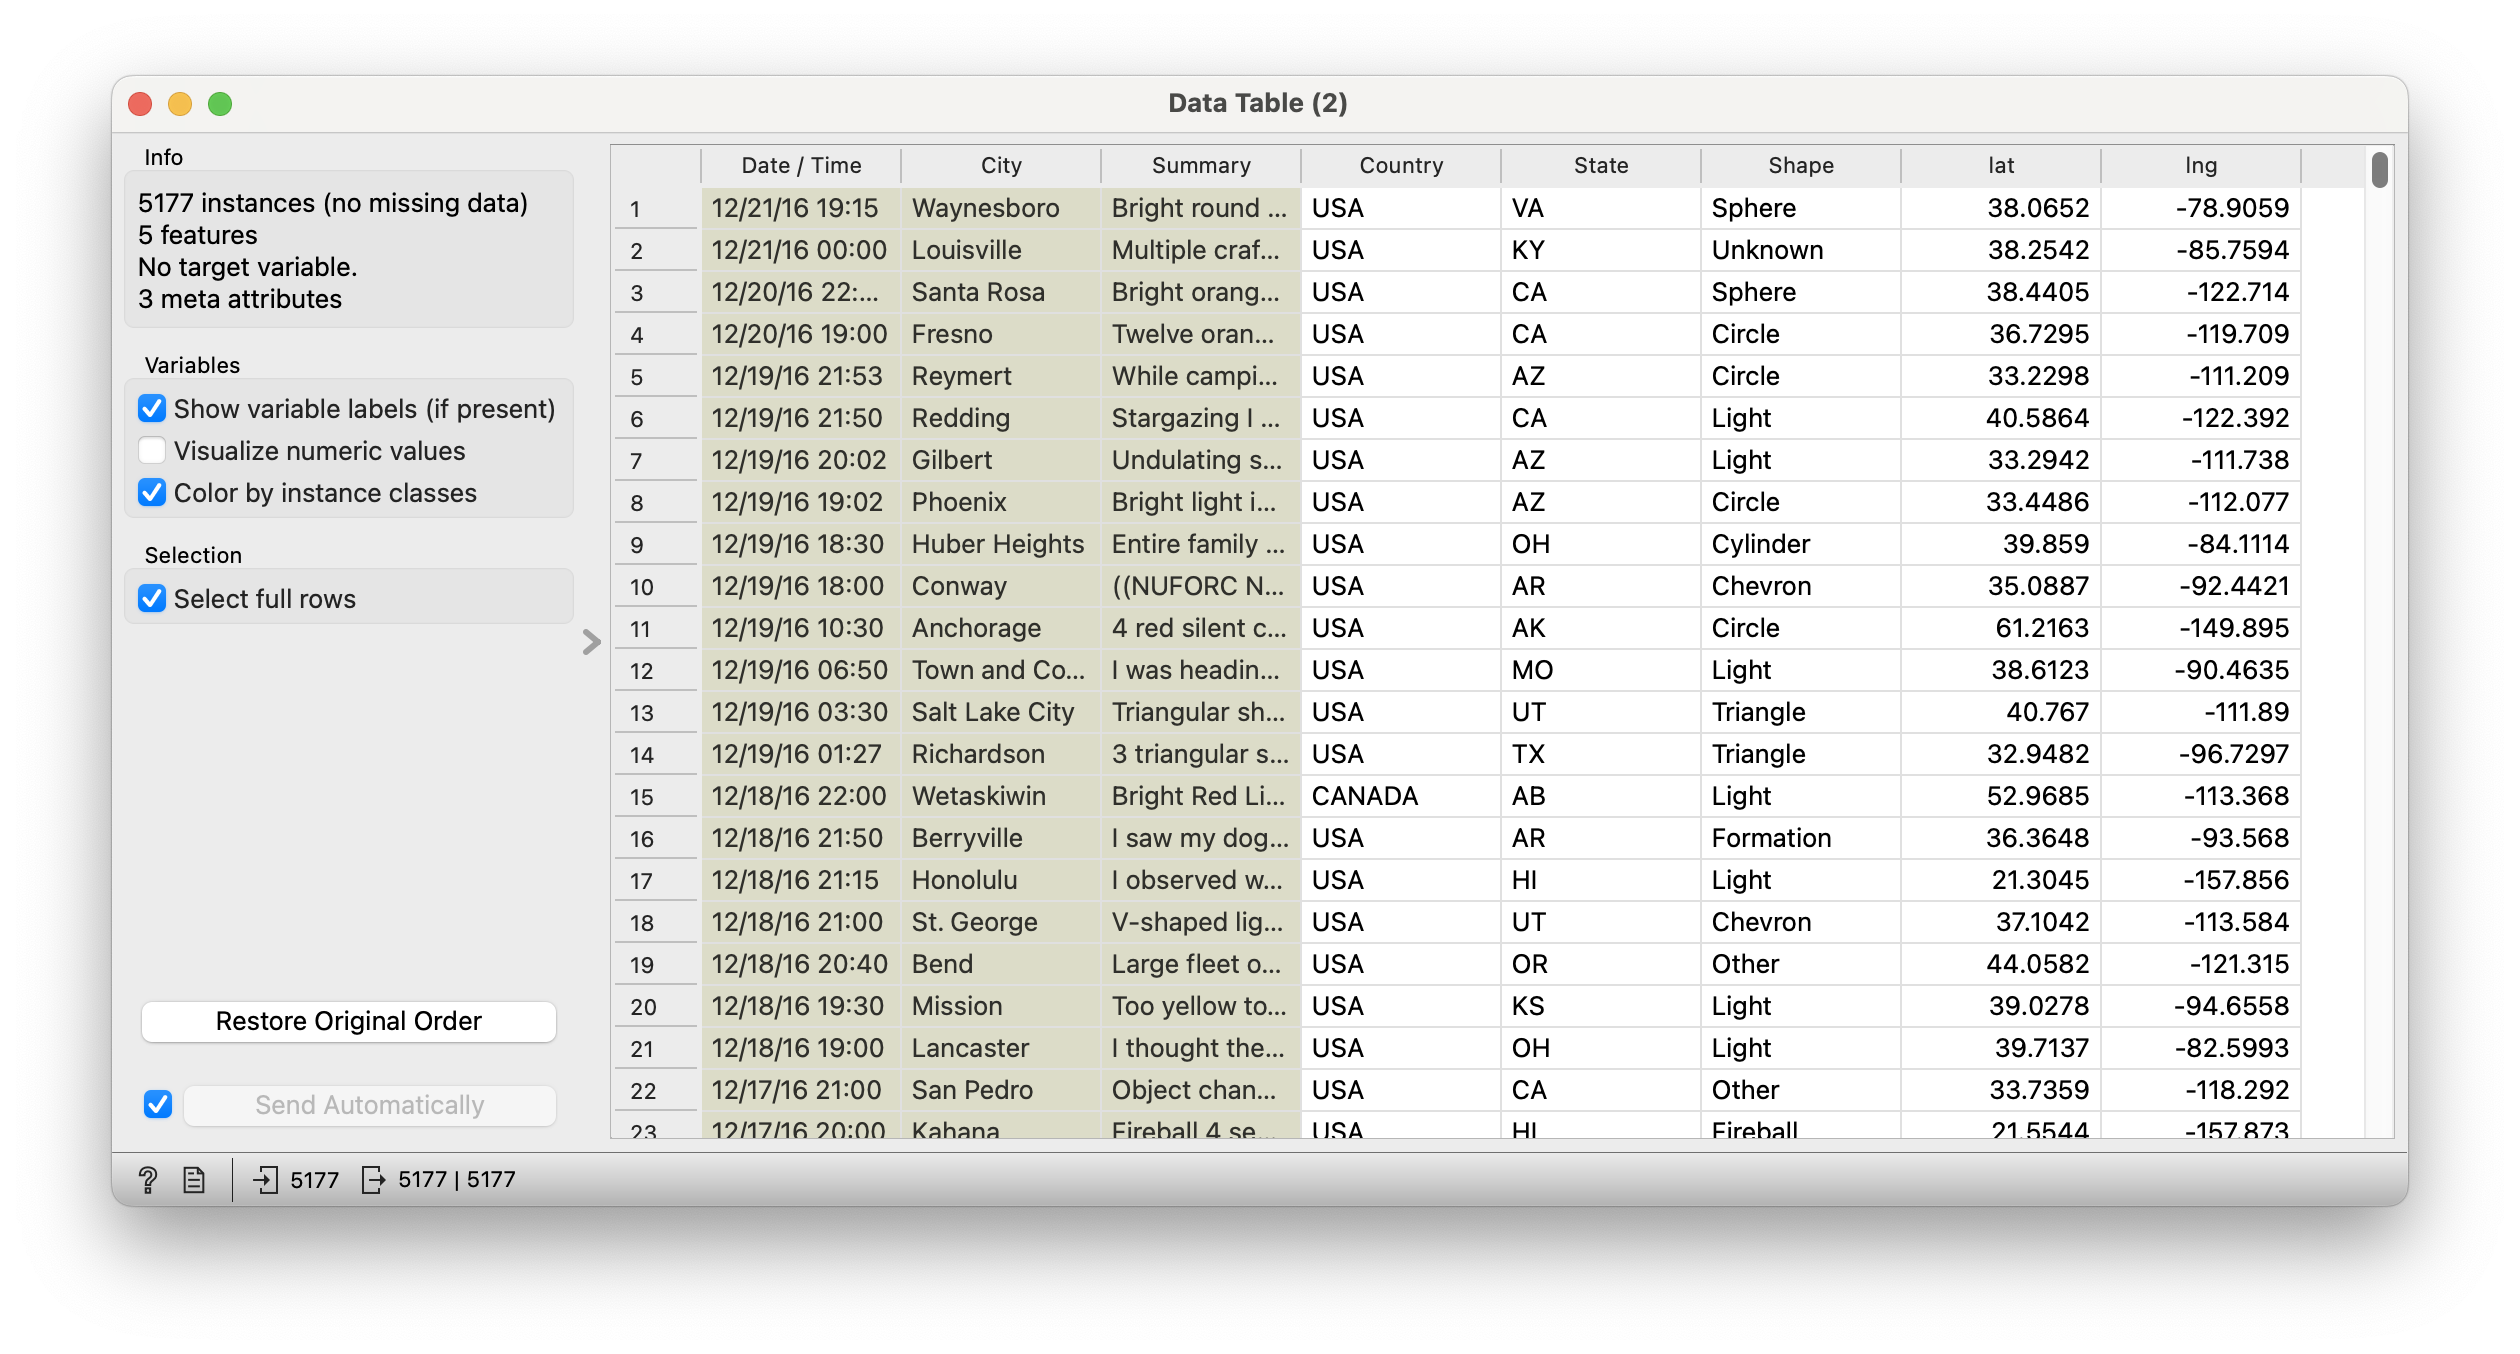
Examine the Data
(a) UFO Data Input
(b) UFO Data Table
Figure 5: UFO Sightings Dataset
Dataset: Animal Migration Tracks
So far we have seen maps that place POINTS on a base map. Let us see if we can get tracks to show…or not, peasants.
Etymology. From Ancient Greek χώρα (khṓra, “location”) + πλῆθος (plêthos, “a great number”) + English map. First proposed in 1938 by American geographer John Kirtland Wright to mean “quantity in area,” although maps of the type have been used since the early 19th century.↩︎